In this third and final article of the first engineering deep dive, we’re going to wrap up calculating PM capacities for columns and drilled shafts. We will discuss and demonstrate how to apply phi factors to change our capacity curve from a nominal one to a factored one we can use. We will compare the final results to those from an established piece of existing software (SpColumn). Finally, an Excel sheet is available for download that uses the information we developed in these articles to generate capacity curves.
Download
I’ll go ahead and put the download link here at the top so it’s easy to find. When you open it, be sure and click “Enable Content” or similar at the top of the file in order for Excel to allow the VBA code to run. I have the worksheets locked so you can’t accidentally break the file, but if you want to take matters into your own hands and edit the sheet, there’s no password or anything. You just click Review, Unprotect Sheet.
Drilled Shaft/Column Capacity Calculator
Here is a gif of the sheet in action:
Phi Factors
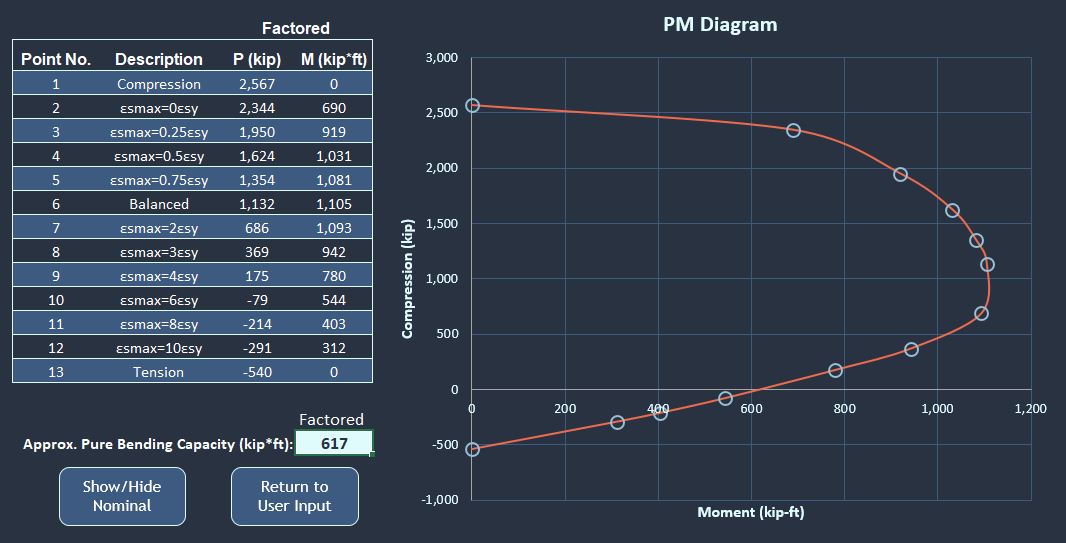
As you can see in the final capacity curves in the gif above, the factored PM curve gets reduced quite a bit from the nominal ones we calculated in parts 1 and 2. Let’s go over how to calculate and apply these.
To reiterate, in this series I will be using AASHTO LRFD Bridge Design Specifications 9th Edition for my assumptions, limits, and phi factors. It would be relatively straightforward to adapt this methodology or this sheet for ACI or another code, as they are similar. There are some differences, however, and we’ll talk about at least one in the comparison section.
The phi factors of interest to us are found in 5.5.4.2. We will multiply both our \(P_n\) and our \(M_n\) value by 0.75 if the case is compression-controlled, and by 0.9 if the case is tension-controlled.
As mentioned earlier in the series, whether a section is compression or tension-controlled is nominally determined by whether the strain in the extreme tension steel (called the net tensile strain, \(\epsilon_t\)) is more or less than that at balance condition. However, AASHTO gives more of a range for the two cutoff points, and if your extreme tension steel strain is between them, we interpolate our phi factor between 0.75 and 0.9. Figure C5.5.4.2-1 illustrates this nicely.
In order to find these cutoff points for tension and compression-controlled sections, we look back at the big assumptions list in section 5.6.2.1. This tells us that a section is compression-controlled if, for reinforcement strength of less than or equal to 60ksi, the net tensile strain is less than the minimum of the yield strain (\(f_y/E_s\)) or 0.002. For 100ksi reinforcement, the compression-control cutoff strain is 0.004, and for steel strengths between 60ksi and 100ksi, you interpolate between 0.002 and 0.004.
For the tension control strain limit, if your reinforcement strength is less than or equal to 75ksi, you use 0.005. For 100ksi reinforcement, it is 0.008, and for steel strengths between 75ksi and 100ksi, you interpolate between 0.005 and 0.008.
This is all we need for our general phi factors! There is one more factor that we have to look at though. In 5.6.4.4, an additional factor for maximum allowable compression loading is discussed. This limit is based on possible load eccentricities. In addition to the usual 0.85*\(f'_c\) and the 0.75 phi factor, we multiply our maximum compression load by 0.85 for sections with spiral confinement, and 0.8 for sections with tie confinement. No factored P values in our diagram are allowed to be greater than that number.
Lastly, we will check the compression member reinforcement limits discussed in section 5.6.4.2. Note that they are slightly different than the common rule of thumb that states you should have at least 1% of your gross cross-sectional area as steel reinforcement. Because of this, our cross-section we used as an example in part 2 was indeed okay. In addition to the minimum reinforcing check, there is a maximum reinforcing check, a minimum number of longitudinal bars allowed, and longitudinal reinforcement is limited to bar sizes 5 and above. These checks are evaluated in the input section of our sheet.
Example Problem
I’ll quickly demonstrate how to apply these phi factors to our example problem from part 2. I assume that there is adequate spiral confinement for the section, but you can select spirals or ties on the Drilled Shaft Column Capacity sheet.
For the pure compression case, we are obviously compression-controlled, so the phi factor is 0.75. The additional eccentricity factor for spirals is 0.85. Our \(P_n\) for that case was 4,026kips, so our \({\phi}P_n\) is \(0.75*0.85*4,026 = 2,567kips\). This is an upper limit on usable compression capacity, so if any of our other points give a \({\phi}P_n\) greater than 2,567kips, then they will be limited down to that value.
For our pure tension case, the section is tension-controlled of course, so we multiply the \(P_n\) by 0.9. So \({\phi}P_n = -600*0.9 = -540kips\).
On the rest of the cases, we will need to refer to our compression and tension-control net tensile strain limits. With 60ksi reinforcement and an elastic modulus of 29,000ksi, the compression-control limit is 0.002, and the tension-control limit is 0.005.
For each case we look at the strain in the bottom-most rebar only, and if it’s less than or equal to 0.002 we multiply both the \(P_n\) and the \(M_n\) by 0.75. If it’s greater than or equal to 0.005 then we multiply both the \(P_n\) and the \(M_n\) by 0.9. If it’s between the two values, we interpolate for our phi factor. Here is a table of those results for our part 2 example problem.
| Description |
Pn (kip) |
Mn (kip-ft) |
Tens. Strain εt |
φ |
φPn (kip) |
φMn (kip-ft) |
| compression |
4,026 |
0 |
-0.0030 |
0.75 |
2,567 |
0 |
| 0εsy |
3,125 |
920 |
0.0000 |
0.75 |
2,344 |
690 |
| 0.25 |
2,600 |
1,225 |
0.0005 |
0.75 |
1,950 |
919 |
| 0.5 |
2,165 |
1,374 |
0.0010 |
0.75 |
1,624 |
1,031 |
| 0.75 |
1,806 |
1,441 |
0.0016 |
0.75 |
1,354 |
1,081 |
| 1 |
1,503 |
1,466 |
0.0021 |
0.75 |
1,132 |
1,105 |
| 2 |
801 |
1,275 |
0.0041 |
0.86 |
686 |
1,093 |
| 3 |
410 |
1,047 |
0.0062 |
0.90 |
369 |
942 |
| 4 |
194 |
867 |
0.0083 |
0.90 |
175 |
780 |
| 6 |
-88 |
604 |
0.0124 |
0.90 |
-79 |
544 |
| 8 |
-237 |
448 |
0.0166 |
0.90 |
-214 |
403 |
| 10 |
-324 |
346 |
0.0207 |
0.90 |
-291 |
312 |
| tension |
-600 |
0 |
0.0021 |
0.90 |
-540 |
0 |
Results Comparison
Last but not least, how do our results stack up against an established piece of software? As I mentioned in part 2, use of a rectangular compression block for circular cross-sections definitely seems to be allowed, but I wasn’t sure it would compare as well as a rectangular cross-section to results that use a more precise concrete compression block.
I took our two example problem results (although I included the effect of compression steel in the results I used for the example problem in part 1) and compared them to the results given by SpColumn.
Note that SpColumn uses ACI factors. In the case spiral confinement and calculating capacities, the factors for ACI and AASHTO are the same, so we can have an apples-to-apples comparison. I wanted to mention this though, because ACI uses a 0.65 phi factor in the case of tied confinement, whereas AASHTO still uses 0.75. So look out for that if you ever are using a tool that uses ACI factors to get capacities for bridge components.
I assumed spiral confinement and got the following comparison results:
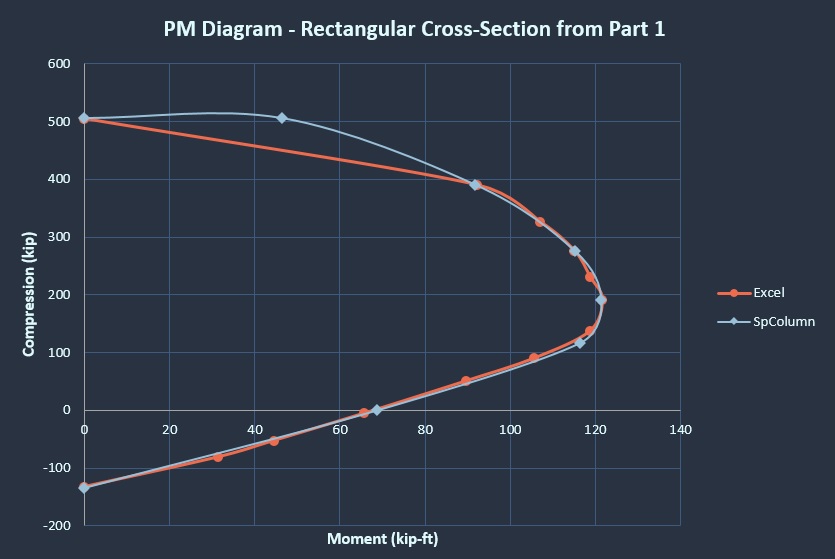
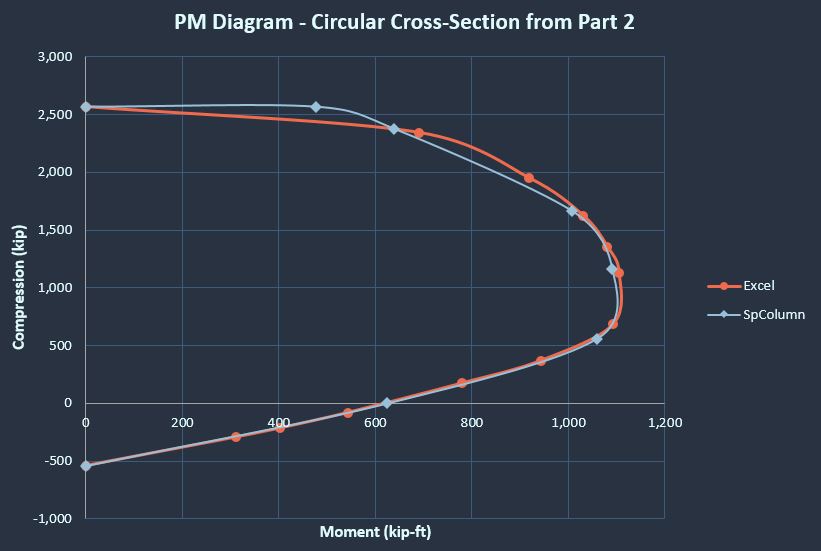
Wow! Those are functionally identical. The only visual difference is just due to not calculating points in the same spots along the curve. In particular, SpColumn calculates a point between pure compression and zero net tensile strain. I’ll consider that a favorable comparison! I guess the people who validated the rectangular stress block knew what they were doing.
Conclusion
This is the end of the journey to making a sheet that can calculate PM capacities for us. I think it’s quite useful, because not only is it lightweight, easy to use, and easy to see exactly what the sheet is doing, but it’s also the only PM capacity calculator that I have access to that uses AASHTO phi factors and reinforcement limits. With those favorable comparisons to SpColumn, I will default to using my sheet in the future for this type of capacity calc!
I hope anyone else finds it useful or gets something out of these articles explaining the approach. Thanks for reading!